We have so much to learn from our planet.
Our mission is to promote conservation, responsible carbon emission, and the wonder of the outdoors through optimization, simulation, modeling, and visualization.
Alaska's salmon runs, by species. Run sizes are approximate, rounded from ADF&G, USFWS and NOAA reports, with years between reported values interpolated. After 2025 the line continues the 2010–2025 trend, tapering over time; it is not a forecast. The warming slider is an illustrative scenario: extra warming phases in from 2025 to 2050 and trims each projected run (Chinook most, sockeye least). The gold specks stand in for warm-water pathogens such as the parasite Ichthyophonus, and gray salmon die before spawning.
One engine, three uses
Everything we make starts as a model of a real system: a watershed, a forest, a supply chain. The model becomes a lesson, a game, or an audit depending on who needs it.
Media & education
Interactive explainers and mini games for classrooms, museums and anyone who wants to understand how a system behaves rather than memorize what it is.
Simulation & modeling
Optimization, agent-based and systems models for land managers, researchers and companies who need to test a decision before they make it.
Carbon consulting
Footprint measurement and reporting built on transparent, reproducible models, so the number on the page can be traced back to the thing that produced it.
The lab
Open experiments. Each one is a small, honest model with the assumptions written down. Play with them, break them, tell us what's wrong.
Alaska salmon runs
Chinook, chum and sockeye returning to the Yukon and Bristol Bay since 1985, with a trend line out to 2050. The map at the top of this page.
Playable aboveAre Atlantic storms getting more severe?
Every recorded Atlantic tropical cyclone since 1851 on a globe you can spin, with wind speed data to test the question yourself.
LiveWatershed
Rain falls on a hillside; land use decides whether it reaches the river clean, muddy, or not at all.
In progressPredator & prey
Lynx and hare on a shared range. Adjust hunting pressure and habitat and watch the cycle shift.
In progressSupply chain footprint
Trace one product from raw material to doorstep and see where the emissions really hide.
Planned
A carbon number you can argue with
Most footprint reports are a PDF and a promise. Ours ship with the model: every emission factor, every boundary decision, every assumption, in a form the reader can inspect and rerun.
- Scope 1, 2 and 3 accounting aligned to the GHG Protocol
- Reproducible models delivered alongside the report
- Plain-language summaries for customers, not just regulators
Who we are
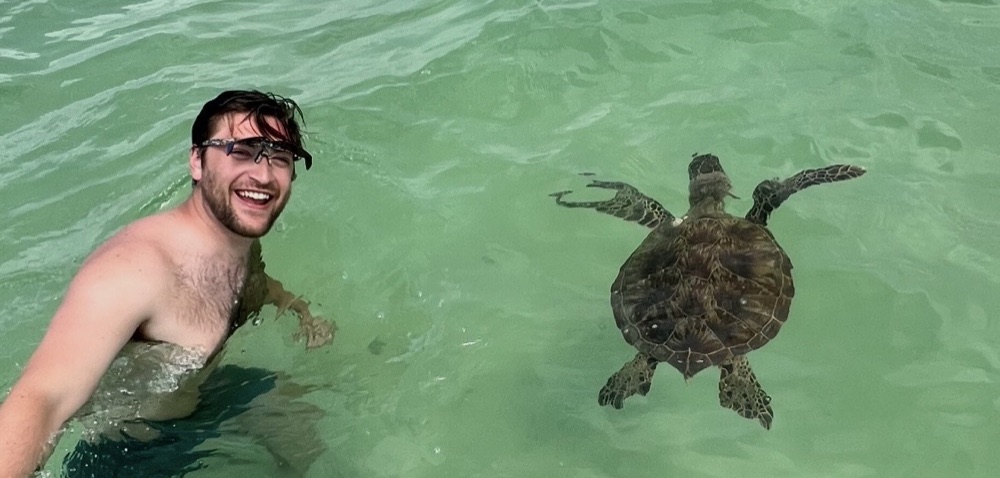
James Palmer, founder
Big Natural Simulations is, for now, just me. I'm an MBA candidate at Stanford GSB. I love spending time outdoors, and I'm always working to sharpen my technical skills.
I created this because I believe people can learn from, and heal in, the natural world. Let's strive to protect it.
Connect on LinkedInHave a system you'd like to see run?
Schools, newsrooms, land trusts, and companies that want their footprint measured properly: write to us.
hello@bignaturalsimulations.com Browse the lab